Planetary Technologies

We aspire to leave the planet in better shape than we found it.

The Sun Has Won Research Note: Historical and Planned U.S. Electricity Generation

The Sun Has Won Research Note: Historical and Planned U.S. Electricity Generation

Rob Carlson, PhD

Managing Director, Planetary Technologies, LLC

PDF

Summary: Wind and solar now constitute the vast majority of newly constructed electricity supply in the U.S., reaching 99.7% of new net generation commissioned in Q1 of 2024. Fossil-fueled electricity generation, produced by burning coal or natural gas, peaked in 2007 and has since fallen by 14% through 2023. In contrast, over that same period, electricity production from renewables, here defined as the combination of wind and solar, has grown by 600 GWh, to about 20% of total U.S. electricity supply. The growth in renewables has more than made up for the decline of fossil fuels, and fossil fuels are now being displaced by the combination of wind and solar, facilitated by battery storage. Utilities and power planet operators expect to shut down increasing amounts of coal-fired electricity production. Some state markets are further into the energy transition than others. The combination of solar and batteries reduced natural gas usage during afternoon and evening hours in California in H1 2024 by approximately 50% compared with the same period in 2023. Similar impacts on gas use are emerging in Texas this year with the commissioning of new battery capacity. Widely trumpeted plans for significant new domestic gas-fired electricity generation are not yet evident in surveys of developers and utilities by the U.S. Energy Information Agency (EIA). While much is made today of a projected increase in electricity demand from data centers, which may delay the expected shutdown of some fossil-fueled production, the low price and capital efficiency of renewables will increasingly outcompete fossil fuels to meet that demand; the medium-, and long-term prospects for fossil-fueled electricity production in the U.S. are poor.

The mix of electricity production sources in the U.S. from 2001 through 2024 is shown in Figure 1. The electricity produced from fossil fuels, a combination of coal and gas, peaked in 2007 at 2.9 TWh and declined through 2023, falling by approximately 14%, to 2.5 TWh. Despite the large rise in natural gas used to produce electricity from 2007 through 2023, which is itself displacing coal-fired generation, the electricity produced from fossil fuel combustion declined even with an increase in total electricity production. The absolute contribution from nuclear and hydroelectric remained flat from 2001 through 2024. In contrast, the combination of wind and solar is growing, constituting >99% of newly commissioned supply in the U.S. in Q1 of 2024. Wind and solar together now supply the marginal watt in the U.S. The combination of wind and solar eclipsed the contribution of nuclear power to electricity production for the first time in March, 2024. Wind and solar together produced more energy than coal through July, an advantage that I expect to be maintained through the end of the year.

In 2024, warmer than expected temperatures across the U.S. increased the demand for cooling, and thus for electricity, which was supplied by increased renewable output and a slight increase in fossil-fuel combustion. From 2025 onward, the EIA expects renewable sources, in particular PV, to grow fast enough to continue supplying the marginal watt and also begin reducing gas-fueled electricity production.

Peaking has peaked

The recent shift in the U.S. electricity supply mix, and in particular the change in fossil fuel combustion and renewable generation, is more obvious when the data in Figure 4 is re-indexed to 2007, as in Figure . Renewables have grown more than fossil fuels have declined, which, in the context of an increase in demand, meansrenewables have been providing all marginal growth while also displacing fossil fuels. Much is made today of an expected increase in electricity demand due to the growth of data centers. This demand may delay the shutdown of some fossil-fueled production. Yet renewables increasingly outcompete all fossil fuels in terms of energy efficiency and capital efficiency, and thus are the best investment for meeting new demand.

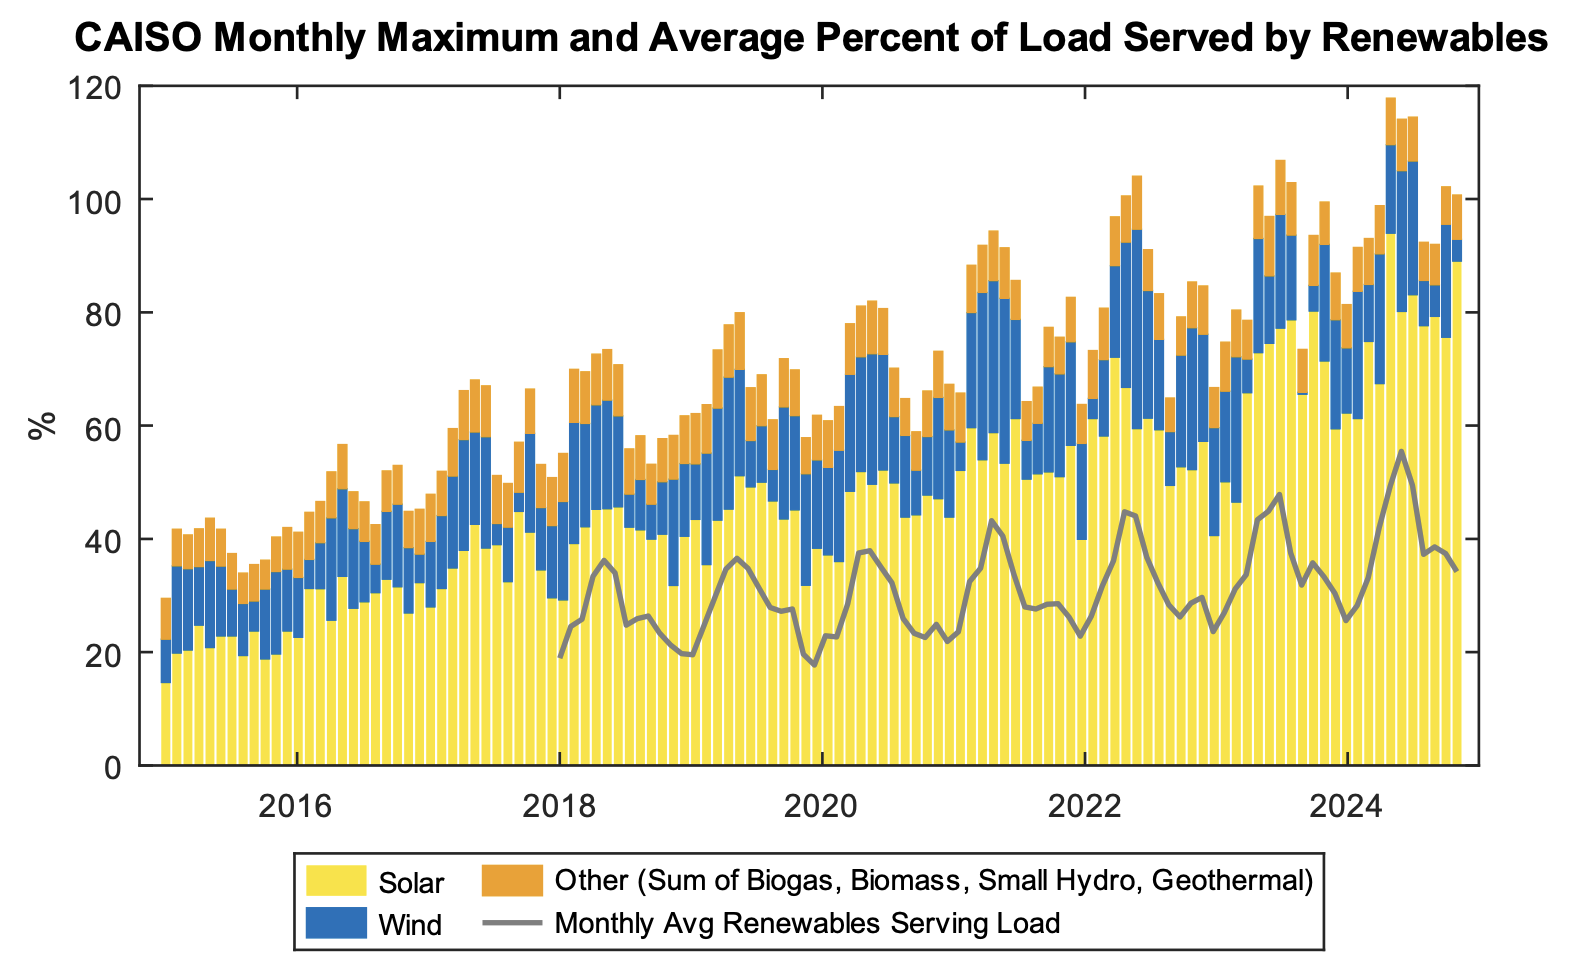
The cost of energy in the U.S. depends on the region in which it is generated and the region in which it is used. However, across the U.S., the maximum unsubsidized Levelized Cost of Energy (LCOE) for PV is now generally well below the minimum LCOE for natural gas turbines used for peaking, and in manycases is below the minimum LCOE for gas combined-cycle generation. The EIA forecasts that very few gas-fueled facilities that might come online by 2028 will produce electricity at a lower cost than PV. As one indication of the impact of this price differential on the development of new gas resources, industrial customers who plan to purchase electricity over decades will take these forecasts into considering when signing contracts, and are likely to specify that they are supplied from the lowest cost generation source. Beyond simple economic considerations, in California, CAISO, the operator of the California electrical grid, is implementing is implementing a policy preference to use renewables and batteries rather than fossil fuels; even with higher capex, the unsubsidized LCOE for the combination of PV and batteries is 1) approaching the lower end of the LCOE distribution for natural gas peakers, and 2) due to falling costs will soon encroach on the LCOE range for combined cycle generation. Gas-fired generation costs less than coal-fired generation, and PV-plus-batteries increasingly costs less than gas. The medium- and long-term prospects for coal- and gas-fueled electricity generation in the U.S. are poor, and that future is visible in planned new fossil generation capacity.

While just over 5 GW of new gas-fueled capacity was brought online across the U.S. during Q1 2023, only 67 MW of new gas capacity was commissioned during Q1 2024, a 98.7% drop. For context, there was about 510 GW of gas-fired generation capacity in the U.S. at the end of 2023, so achieving even 1% growth in gas-fired capacity would require a net change of about 5 GW. According to the EIA, in 2024 developers expect to add a total of just 3.2 GW of new gas combustion capacity, compared to at least 44 GW of wind and solar and at least 14 GW of batteries. However, as of September, approximately 3 GW of gas-fired capacity had already been reported retired in 2024, with a total of about 3.8 GW expected retirements by the end of the year based on EIA survey responses. Thus the net change for gas-fired capacity in 2024 is likely to be negative. To be clear, the total electricity generated from gas rose slightly in 2024 due to higher output from existing facilities, while, according to EIA data, the number and power output capacity of those facilities contracted. Additionally, about 2.6 GW of coal-fired generation will be retired in 2024, with none added. As a result, 2024 may be the first year in which renewables displace both gas and coal capacity from the U.S.grid. But one datum does not a trend make. Whether this turn of events is maintained over the short term will depend significantly on the rate of retirements and will have to be assessed on an annual basis.

Both gas- and coal-fired generation capacity are likely to shrink this year. Thus 2024 may be the first year in which renewables displace both gas and coal capacity from the U.S. grid.

Going forward, based on surveys of plant operators and utilities, the EIA does not expect more than modest new gas resources to be commissioned over the next five years (Figure 5), which of course will be offset by annual retirements. Instead, batteries are providing grid services formerly purchased from gas-powered generators. Net energy generation from solar grew 25% year on year through May, 2024. The EIA forecasts that net generation from solar will increase 42% in H2 2024 compared to 2023, and generation from wind will increase by 6%. Where there are already significant battery resources deployed in combination with renewables, gas use appears to be falling.

The Best Time to Deliver Electrons is Today

SunTrain Moves Electrons, Balance Sheets, and Rates of Return

PDF

Summary

SunTrain is developing technology that enables point-to-point electricity distribution as a service using existing Class 1 rail infrastructure, a capability that the company calls Trainsmission. SunTrain last week announced the Wireless Alternative by Train Transport (WATT) pilot project in Denver with Xcel Energy that will transport electricity stored in batteries via freight rail, connecting customers to renewable energy resources that are currently curtailed or unavailable due to transmission constraints.

The former coal burning Cherokee power plant in Denver has both a rail connection and an electrical substation that serves the city. Xcel has renewable resources located elsewhere in the state that the company is unable to connect to Denver. This is an example where Trainsmission is not just a good solution for moving energy to this location, it is the only tenable short term solution as no new transmission wires will be built in the area for many years to come. Moreover, Xcel has already made the calculation and found that, relative to new transmission, “the capital costs [of Trainsmission] are small by comparison”.

The immediate impact of the pilot project will be a demonstration of Trainsmission to current and former fossil fuel burning facilities in urban areas that are already connected to Class 1 rail and electrical substations, while also laying the groundwork for multi-state utility Xcel to meet Denver's goal of using 100% renewable energy by 2030. The broader impact will be a demonstration of the speed and capital efficiency of delivering stored energy using existing infrastructure that 1) speeds up the development and use of wind and solar resources to replace expensive and polluting fossil fuels, 2) thereby puts capital to work on an accelerated schedule, and 3) enables more rapid economic development by overcoming existing barriers to deliver energy to new sites of commercial and residential demand.

That Xcel is so interested in Trainsmission confirms that the most important metrics for evaluating its utility are capital efficiency and timeliness; moving energy in batteries via existing freight rail lines provides electrons as soon as the railroad cars are constructed and rolling. Trainsmission facilitates moving energy from new, inexpensive renewable sources to customers approximately ten years sooner than waiting for wires to be built. This technical capability to immediately move energy on existing infrastructure then has implications for economic development in urban environments in which residential and commercial development is constrained by the absence of electricity.

Trainsmission can be used to deliver energy across many application areas, including 1) enabling new industrial demand, such as data centers, to come online before wires can be built, 2) enabling new production capacity to vault interconnection queues, 3) supplying customers who will never require a hardwired interconnection, 4) demand charge avoidance, or “Critical Peak” tariff avoidance, 5) emergency power supply and power supply resilience. Multiple academic studies over the last five years, which analyze different use cases and utilize different assumptions, corroborate the favorable economics of Trainsmission as conceived by the team at SunTrain.

The inherent flexibility of Trainsmission facilitates rethinking electricity distribution. Large, mobile batteries simultaneously solve the problems of distribution and storage while enabling time- and place-shifting of electricity supply. Below I explore the advantageous elements of Trainsmission compared to transmission, and introduce several application Case Studies.

The Sun Has Won Research Note: Discerning Trends in PV Installation Data

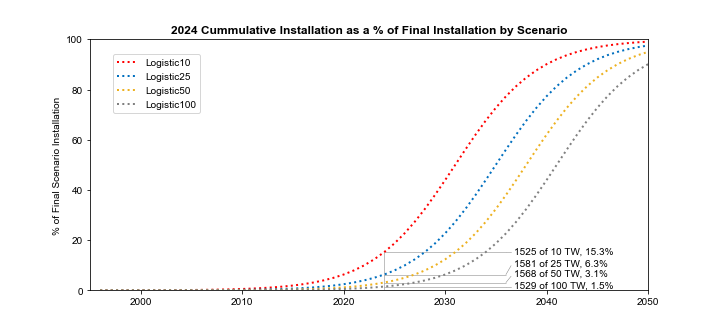
Summary: Estimating future annual photovoltaic (PV) installations is critical for planning the buildout and operation of energy systems at scales ranging from individual homes, to cities, to nation states, to continents. Yet annual installation rates continue to grow so fast that reality makes a regular habit of surpassing even near-term forecasts, frequently in just one quarter. Linear models of PV installation are ahistorical, have been poor predictors of future deployment rates, and consequently mislead in regards to capital investment, labor requirements, and emissions reductions. The forecasting challenge is compounded by temporal and geographical variability. There are at least three different historical price eras for PV, with different market dynamics, and there are today at least four distinct PV markets, with installation rates determined by contrasting local policy priorities. Due to this variability, different models of future market installation that are consistent with historical installation data can produce final installation totals, and maximum installation rates, that span more than an order of magnitude; existing data are consistent with a 2050 installation total of 25–100 TW, and a maximum installation rate of 600 GW to 6 TW per year. In other words, we cannot distinguish between a wide range of outcomes given existing data. Nevertheless, the exercise of comparing models to the historical record can help delineate and constrain the range of our ignorance, which provides a basis for evaluating scenarios for PV installation over the next three decades.

DOWNLOAD PDF

The Sun Has Won Research Note: German Renewables Growth and Economic Impacts

The Sun Has Won

Research Note: German Renewables Growth and Economic Impacts

File: PDF

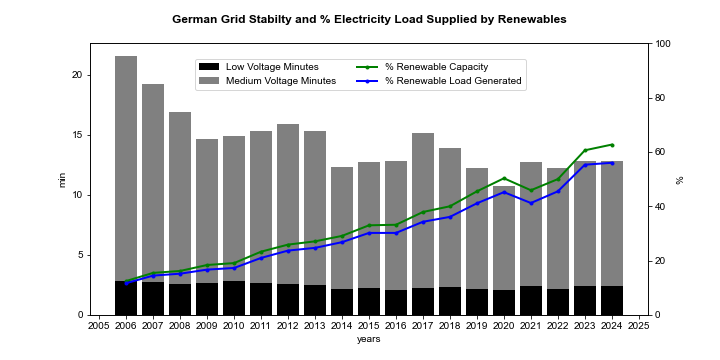
Summary: Germany continues its progress toward a cleaner, greener, more efficient economy. Renewable sources provided 55% of total German electricity generation in 2023 and surpassed 60% of total generating capacity. The rise in renewable generation is contemporaneous with 1) an increase in stability of the German grid, 2) an increase in GDP, and 3) a reduction in CO2 equivalent emissions. After spiking at the outset of war in Ukraine, wholesale electricity prices in Germany are falling and are now modest compared with peer economies in Europe. While the German economy is facing a variety of challenges, leading The Economist to wonder whether the country is “once again the sick man of Europe”, that man is breathing ever cleaner air and has an increasingly capital-efficient energy production system. Ongoing deployment of renewable energy production will lead to greater fitness and improving economic health. This Research Note updates and expands reporting and analysis from The Sun Has Won.

Figure 1: German national grid interruptions since 2006, share of renewable electricity capacity, and share of renewable electricity generated. (Sources: German Federal Network Agency and Fraunhofer ISE)

Figure 2: Top: German economic output per exajoule of primary energy consumption (calculated as GDP per unit of primary energy consumption). Bottom: German CO2 equivalent emissions, GDP growth, and Primary Energy (PE) Consumption. (Sources: World Bank, Destatis, Clean Energy Wire, Fraunhofer Institute)

Figure 3: German wholesale electricity prices compared to prices in Switzerland, Spain, France, Italy, The Netherlands, Poland, and Sweden. (Source: EMBER)

The Sun Has Won Research Note: China Solar PV Installation Trends And Implications

The Sun Has Won

Research Note: China Solar PV Installation Trends And Implications

(PDF)

Summary: China dominates global solar photovoltaic (PV) manufacturing and domestic installation. China by itself installed an estimated 265 GW of PV, or 60% of the global total, in 2023. China's domestic installation is such a large fraction of the global market that changes in domestic demand may have increasingly important global consequences. Moreover, any uncertainty in China's domestic financing of manufacturing, or in government policy that influences manufacturing, could affect module availability worldwide. A contraction of domestic Chinese installation could result in a global glut of modules, and a contraction of Chinese manufacturing could result in tightening supplies, with either event influencing global prices. One ameliorating factor to emerge in the wake of the pandemic and war in Europe is the apparent rise of the warehousing of modules, which can buffer fluctuations in both supply and demand. Given China's present dominance in all phases of module manufacturing, I estimate it will be 5-10 years before domestic investment in new manufacturing in other countries will modulate China's impact on global supply and prices, a topic that I will cover in an upcoming report. This Research Note updates reporting on China from The Sun Has Won, Part 1.

Caption: PV installation in China is dominating global trends. Top Panel: Absolute annual PV installation inside China and outside China. Middle Panel: Annual percentage growth in installed PV. The ex-China percentage growth is calculated with respect to ex-China installation, not with respect to global installation (which would include China). Bottom Panel: China's contribution to annual global installation. Data as of January, 2024. (Source: BloombergNEF, Planetary Technologies)

The Sun Has Won, Part 1: Market Inevitabilities In Electricity Production

Today we publish the first in depth Research Report from Planetary Technologies. Here is the PDF:

The Sun Has Won, Part 1: Market Inevitabilities In Electricity Production”, by Rob Carlson, Managing Director.

The Sun Has Won, Part 1: Market Inevitabilities In Electricity Production

Rob Carlson, PhD, Managing Director, Planetary Technologies, LLC

Summary: Solar power now provides the lowest cost electricity generation in history. The continuing decrease in solar costs is driven by technological change, economies of scale, and by learning effects derived from the expansion of manufacturing. This cost trend is coupled to an annual exponential increase in solar installation that has run for more than 25 years and that is likely to continue, if not accelerate. Falling costs for solar power are accompanied by a long-term shift in the structure of investment; in 2021 more money was invested on an annual basis into renewables projects than into fossil fuel projects, more new solar power was built than any other generating capacity, and the cost of capital for solar projects was at least 4X lower than for fossil fuel projects. As a result, new solar installation now constitutes more capital-efficient electricity generation than any other source with the exception of wind, which is economically and physically efficient only when installed at very large scales. Taken together, these factors reveal that solar power is now a better, and lower risk, investment than new fossil-fueled electricity projects. Despite this cost advantage, many countries will continue to build and operate coal and gas generating capacity because 1) these facilities provide both electricity generation and employment, and 2) constructing adequate manufacturing capacity for renewables to fully replace fossil fuels is likely the work of decades. Yet by approximately 2025, operating the vast majority of existing fossil fuel power production will be inefficient and uncompetitive when compared to the combination of new solar power and battery storage. To the extent that local energy costs for manufacturing and services determine global competitiveness—particularly in any manufacturing process that uses, or can be adapted to use, electricity—the cost advantage brought by deploying low-cost solar will drive adoption in regions that wish to succeed economically. The economic and financial advantages of solar relative to fossil fuels suggest that the next thirty years will see solar power come to dominate global electricity production.


Whereas the marginal cost of electricity production by PV and wind is approximately zero, to produce ongoing value at fossil-fueled electricity plants requires the constant incineration of capital.


Excerpts:

The sun has won

The fundamental advantage of solar power over fossil fuels is that, for the same total investment, solar produces more useful energy than does combusting fossil fuels. That is, solar power is more capital-efficient than fossil fuels. Therefore, continued spending on fossil fuels is spending on economically uncompetitive electricity production. To be sure, there remains money to be made from fossil fuels in the short term because most electricity production capacity extant today requires combustion; it will be the work of decades to replace it. Nevertheless, over the long term, public or private organizations that continue to invest in fossil fuels will be building structurally inefficient infrastructure, with attendant higher operating costs, that will hinder economic performance.

How should we measure the financial advantage of solar over fossil fuels, and with which units? Capital efficiency is typically defined to be a ratio that describes return on investment or on operational spending, where the specific numerator and denominator might be an absolute amount of investment or a rate of investment chosen to suit a particular narrative of financial performance. Here I define Capital Efficiency as energy produced per dollar invested over the lifetime of a power plant, in units of MegaWatt*hours per dollar (MWh/$), which is the inverse of the unsubsidized Levelized Cost of Energy (LCOE) for utility scale generation (Figure 1).

The LCOE (inset, Figure 1) takes into account all contributions to lifetime cost, including maintenance and finance, and is therefore a means to compare disparate energy production technologies. The LCOE of solar has fallen steeply over the last 15 years. However, pandemic-related supply chain issues have affected solar power hardware costs in the same way as costs in other sectors. The prices for solar module components such as silicon, aluminum, and glass have followed the price of energy where it is set by the cost of fossil fuels, which rose through the 12 months prior to the publication of this document, and which increases will undoubtedly show up in future LCOE data sets. Further price impacts may be felt from the outbreak of hostilities in Europe and subsequent sanctions.

Figure 1. The Capital Efficiency for utility scale generation, here defined as the inverse of the Levelized Cost of Energy (LCOE) (Inset: Lazard's mean LCOE). The LCOE takes into account all contributions to lifetime cost and is therefore a means to compare disparate energy production technologies (Source: Lazard, Planetary Technologies).

Yet the cost of electricity from already-operating solar has not been affected by fossil fuel price fluctuations because the cost of sunlight does not depend on the price of coal or gas, nor upon any state of war. Prices for renewable energy are quite stable over time, and the use of that energy for commercial operations comes at a lower cost and carries a lower risk than reliance on fossil fuels, which fluctuate in price and availability. This fact points to an inevitable future. As photovoltaic modules, and all their constituent components, are increasingly manufactured using electricity produced by photovoltaic module installations, the cost of new modules will become decoupled from the price of fossil fuels and will fall even further. The implication of the long term cost trend is very clear; solar power is the future of electricity generation.

The economic reality that solar power is less expensive than fossil fuels creates certain market inevitabilities:

  1. Most obviously, the cost advantage of solar power will accelerate the installation of photovoltaic (PV) electricity generation around the globe. This expansion will proceed even without significant improvements in PV efficiency due to extant cost advantages, and the resulting increase in PV manufacturing will by itself continue to expand these cost advantages modestly due to improved economies of scale and learning effects.

  2. Because renewables in general, and PV in particular, are more capital-efficient than fossil-fueled electricity generation, investment will increasingly shift from fossil fuel projects to renewables. To sharpen that conclusion: money that is now spent on fossil fuels will instead be spent on renewables. Headlines and commentaries that fret about the costs of the electrification transition fail to recognize that investment in renewables represents not additional spending, but rather displacement of spending on fossil fuels. Because renewables are more Capital Efficient than fossil fuels, this shift will free up significant capital that may be invested in more lucrative and beneficial projects.

  3. A corollary of the cost and competitive advantage of renewables is that energy and climate scenarios that posit any significant coal or gas combustion in 2050 are assuming highly irrational economic behavior occurring not just once, but persisting over the next three decades. Such scenarios are likely of limited utility as planning tools for guiding policy and investment.

  4. Finally, now that PV has crossed below the cost threshold at which fossil fuels operate, PV will begin competing with itself and other low-cost renewables (e.g., wind) rather than with fossil fuels. Given that solar is already improving exponentially, competition will spark an intense demand for technical improvements that reduce the installed cost per watt. Schumpeter's gale will blow through the solar industry just as it is doing in the rest of the energy industry.

Distributed solar contributes to grid stability

Figure 2. German national grid interruptions since 2006 and share Renewable Electricity Production (Source: German Federal Network Agency and Fraunhofer ISE).


Renewable energy skeptics frequently argue that an increasing reliance on variable wind and solar generation will necessarily result in grid instability. In reality, the German electricity grid became more stable between 2006 and 2020 while the share of renewable electricity generation grew from 6% to 50% (Figure 2). Over that same period, the absolute amount of electricity generated from nuclear and fossil-fueled power fell by 50% and 60%, respectively. The anti-correlation of renewable capacity and grid instability across an economy and a grid the size of Germany's stands as sufficient to refute the stability skeptics. Yet the case is stronger; the increase in grid stability has been causatively attributed to 1) the vast majority of PV installations in Germany being at the community scale or smaller, and 2) those distributed installations accounting for more than half the total PV generating capacity in the country. At a minimum, one can conclude that renewable capacity of at least 50% is compatible with increasing grid stability, even before widespread battery deployment, if system administrators choose to pursue these combined goals. There is no reason to expect this result to be localized to Germany. Consequently, given the combined economic benefits of lower electricity prices and fewer interruptions, grid stability concerns around the world may accelerate rather than retard PV adoption. The grid stability benefits of distributed generation may become recognized as a means to reduce spending on infrastructure maintenance and upgrades, an advantage that improves the value proposition of rooftop and community solar.

Sunfight at the PV Corral

The future course of PV installation around the world is best understood through evaluating the recent past, and in particular the impact of the rapid decrease in PV costs on the displacement of fossil fuels. There are three distinct relative price Eras to consider, as illustrated in Figure 3.

Figure 3. At the top, a sketch illustrating the relative number of new PV installations and fossil fuel projects as the relative Capital Efficiency has shifted since 2009. In Era 1, PV installations were driven primarily by policy. In Era 2, PV installations were driven by a mix of policy and price. In Era 3, new PV is less expensive than operating fossil fuel plants and installation is driven by price. Bottom: Capital Efficiency (1/LCOE), repeated from Figure 1.

In Era 1, the vast majority of PV installations produced less electricity per dollar than those burning coal. The global weighted average Capital Efficiency for utility scale PV reached approximate parity with coal for the first time only in 2013, and with gas for the first time in 2016. During Era 1, large scale PV installations were driven by subsidies or other policy measures. In Era 2, the “approximate parity” time period, from 2013 up through approximately 2016, it could still be argued that a rational economic actor evaluating new electricity production could choose fossil fuel combustion based on Capital Efficiency. However, from 2016 onwards it has become increasingly difficult for a rational economic actor to decide in favor of fossil fuels over renewables. In Era 3, new renewables are clearly more Capital Efficient than fossil fuel combustion. Given the economic and financial trends described throughout this report, it is apparent that most energy project developers, and their financiers, are now behaving rationally and deciding to install renewables, primarily PV. The incentives in Era 3 are the converse of those in Era 1; going forward, any new fossil fuel combustion capacity installed will be driven by subsidies and policy measures, and will arguably reduce economic competitiveness. The continued roll-out of electricity storage globally will further accentuate the economic advantage of renewable electricity by enabling time-shifting of supply and thereby enabling elimination of expensive fossil fuel peaking capacity. In geographies in which installing new wind and PV today costs less than the marginal cost of coal and gas as fuel, continuing to operate the existing combustion fleet already impairs economic competitiveness.

Conclusion

What, then, is the plausible future of solar power? Part 1 of this series has explored the economic and financial constraints on solar power installation over the coming decades. We are now in an era in which every dollar spent on new PV displaces higher cost fossil-fueled electricity production. From this vantage point, it appears likely that there will be as much capital available as can be utilized to build and deploy new renewables around the globe. The practical constraints on the amount of new PV that capital can buy and install include 1) the availability of new solar modules, that is, the combination of the availability of raw materials and of module manufacturing capacity, 2) the availability of installation hardware such as mounting systems, and 3) other factors such as land acquisition, regulation and permitting, and grid connections.

At a more abstract level, there may be a concern among some analysts and commentators that growth rates greater than 20% cannot be maintained simply because it is difficult to imagine that a large quantity can continue to rapidly grow. What are the appropriate considerations for determining the short-term and long-term trajectories for installation? The growth of global IT infrastructure and computational resources, and in particular data centers, serve as an example of a capital- and energy-intensive industry that has been accelerating for decades. Part 2 of this series will focus on a quantitative exploration of reasonable limits for total PV installation at a global scale and how quickly we might bump up against those limits.


For additional insight into the future of electricity production markets, please see the full report, “The Sun Has Won, Part 1: Market Inevitabilities In Electricity Production”.


Creative Commons image licence (Attribution-NoDerivatives 4.0 International (CC BY-ND 4.0)) terms: 

  • Share — copy and redistribute the material in any medium or format for any purpose, even commercially.

  • Attribution — You must give appropriate credit, provide a link to the license, and indicate if changes were made. You may do so in any reasonable manner, but not in any way that suggests the licensor endorses you or your use.

  • NoDerivatives — If you remix, transform, or build upon the material, you may not distribute the modified material.

All other content ©2022 Planetary Technologies.

On the Opportunities and Challenges of Powering Biomanufacturing with Electricity

Planetary Technologies invests at the leading edge of industrial revolutions. We embrace two investment theses. First, biology is a foundational technology that is driving a fourth industrial revolution. Second, this revolution must be powered sustainably, which requires accelerating the transition to renewable electricity while reducing carbon emissions.

From our founding, a key investment hypothesis for Bioeconomy Capital, and now Planetary Technologies, was that, eventually, biomanufacturing would be powered not by sugar but rather by electricity drawn from the grid. We already have two portfolio companies doing just that: Upward Farms and Lumen Biosciences. Both companies have taken advantage of the precipitous drop in the cost of LEDs to grow photosynthetic organisms indoors at higher yields, and with far better economics, than outdoor production. As these companies scale up their manufacturing operations, we need to give careful thought to where all that electricity comes from. What good is carbon-negative, widely distributed biomanufacturing if it is ultimately powered by burning fossil fuels? This question points to the conundrum that biology, as powerful as it is, cannot, by itself, be used to solve all problems.

To that end, we have been on the lookout for opportunities that help accomplish our broader goal of reducing carbon emissions through accelerating the transition away from fossil fuels and towards electrification. That is where our portfolio company Tandem PV comes in. Tandem PV is commercializing a next generation photovoltaic (PV) material known as a perovskite. Perovskites can be tuned to absorb different wavelengths of light than existing commercial silicon solar cells, and therefore the two technologies can be combined into high efficiency "tandem" PV modules. Whereas commercial silicon cells today are about 21% efficient, and are on course to reach 25% in 2050, tandem modules should reach 25% efficiency within two years and then reach 30% efficiency within 5 years. Tandem PV is particularly focused on developing methods for large scale, high throughput manufacturing of perovskite layers on the large glass sheets used to enclose all silicon PV modules. This product will enable the Company to build so-called "mechanically stacked tandem modules" that combine its peroskite-coated glass with commodity silicon PV cells, or, in other words, to make customers of all existing module manufacturers. Tandem PV recently received a large US DOE grant in support of producing full size (1m x 2m) mechanically stacked tandem modules.

Next, once you start digging into limits on renewable electricity production, you soon discover that the bottleneck to deployment is not in building more wind or solar production, but rather in distribution. Consequently, Bioeconomy Capital recently led the Seed round for a StealthCo that is commercializing a new approach to point-to-point electricity distribution. There is already extraordinary demand for electricity distribution as a service — we closed this investment on a Friday afternoon, and contract negotiations with customers started the following Monday morning. The StealthCo will make noise, and move electrons, soon. In the meantime, here is a sample of our thinking about the challenges and opportunities to deploying renewable energy faster.

The Sun has won. According to the International Renewable Energy Agency (IRENA), the best new solar projects now provide the cheapest electricity in history. The fundamental reason that solar energy costs are low, and continue to fall, is a combination of technological progress and economies of scale. This cost trend has in turn led to an annual exponential increase in solar installations that has run for more than 25 years and that is likely to continue (Figure 1), if not accelerate, a topic we will take up in a forthcoming post. The unsubsidized cost of energy from new-build solar photovoltaic (PV) has already fallen below the marginal cost of operating coal or combined-cycle gas generation for half the Earth’s population, with the other half soon to follow. That is, new-build PV now costs less than buying coal or gas as fuel for existing facilities.

Figure 1. Global annual installations of PV have grown exponentially for more than two decades. (Sources: BloombergNEF, Bioeconomy Capital.)

In the U.S., more than 90% of coal and combined coal-gas capacity operated at a loss in 2020 compared to installing new PV. The EIA forecasts that from 2022 onwards, new renewables in the U.S. will displace both the share of natural gas in electricity production and the absolute volume of gas burned to produce electricity. Similarly, in Europe, new renewable electricity is already reducing natural gas use, even before war accelerated renewable installation plans.

Yet renewable energy deployment could be moving much faster than it is. In the U.S., at the end of 2021 there was nearly 700 GW of wind, solar, and storage — which is the equivalent of about 19% of existing U.S. electricity generation capacity — stuck in what is called the "interconnection queue", waiting for approval from grid operators and regulators to connect to the grid. Accelerating this construction would transform the American economy. The impact of this potential renewable revolution is frequently discounted even by knowledgeable industry observers, who simply say, based on history, "yes, but most of that will never be built". This has indeed been true in the past. But rather than accept this statement as a fact of life, we treat it as an opportunity to understand and profit from.

Electricity grids are complex engineering, economic, and political entities. Change can be slow. The owners and operators of regional electricity grids must approve applications to connect to those grids before new projects can exit the queue, which can take up to 8 years, depending on the jurisdiction and type of project. Moreover, due to overly bureaucratic restrictions on the structure of financing, constructing the interconnection itself for a new project can amount to as much as the rest of the cost of the project put together, thereby potentially doubling total project costs. New installations can also be slowed by local resistance to building transmission lines. These problems are also present in Europe, in particular in Germany, which has copious wind resources in the north, copious industry eager to electrify in the south, and copious NIMBYs in between.

Beyond the time and cost required to connect to the grid, simply transmitting electricity through existing wires has been getting more expensive in the U.S. for at least a decade. At present, approximately half the retail cost of electricity is due to pushing electrons through wires (Figure 2).

Figure 2. Electricity production costs have fallen for the last decade as more wind and solar is connected to the grid. In contrast, delivery costs for electricity in the U.S. have increased and are now approximately equal to production costs. (Source: EIA.)

America's grid is aging and requires upgrading. U.S. utilities have steadily increased spending on opex and capex for two decades (Figure 3). New investment includes underground lines, towers, overhead lines, poles, and substation equipment. Operations and maintenance includes substation equipment, load dispatch, power lines, transmission. To date, this spending has only increased transmission costs and thereby reduced the capital efficiency of the existing grid.

Figure 3. Opex and capex spending on the grid have both increased substantially on an annual basis for two decades. (Source: EIA.)

This combined cost and friction of building new electricity connections comprise a substantial stumbling block both for renewable energy producers and for new businesses that require access to those green electrons. Lumen Biosciences and Upward Farms have had to find creative solutions to ensure that they have access to sufficient electricity to power their biomanufacturing operations. But the problem is much broader and is faced by any company wanting to ensure it promptly receives adequate electricity, particularly if it needs to be certifiably renewable. Similarly, developers of wind and solar electricity generation capacity would benefit from expeditious and reliable means to deliver their power to customers. Recognizing that these are problems to be solved, rather than simply lamented, opens the door to considering fundamentally new approaches to distribute electricity. We look forward to sharing more as our StealthCo investment in this area matures.

Upward Farms Technical White Paper

We work in a variety of ways to help our portfolio companies succeed. Below is a Technical White Paper we wrote to assist Upward Farms, an indoor agriculture company, in describing to late stage investors the Company’s approach to engineering complex ecosystems for food production. Upward Farms is a Bioeconomy Fund 2 portfolio company.

As part of the analysis, we formulated multiple hypotheses about the future of the Company, its technology, and more generally about engineering complex, biodiverse ecosystems. Upward Farms is moving so quickly that many of the scientific & technical hypotheses that we proposed just months ago have already been confirmed and are now the basis of new products in development. Consequently, this document wound up serving not just as marketing material for Upward Farms, but also helped the team move faster on science, engineering, and commercialization.

Here a link to a PDF of the White Paper. And here are the Summary and Introduction:

Upward Farms Technical White Paper

Rob Carlson, PhD, Bioeconomy Capital

May, 2021

Summary: Upward Farms has overcome the economic barriers to scaling indoor vertical farms by innovating at the intersection of hardware, software, and ecosystem engineering. The Company focuses on mastering the management of biodiverse ecologies, which is the key to its existing competitive advantage and to its future potential. Quantitative field studies have conclusively demonstrated that diverse ecosystems are more productive and stable than monocultures, and that a key driver of these advantages is an appropriately complex microbiome. This complexity is eschewed by other vertical farms, in which inefficient crop monocultures are stabilized only through costly energy and chemical subsidies. In contrast, Upward Farms constructs resilient systems that utilize the complexity in biodiversity. The biological engine powering Upward Farms is integrated aquaculture, in which plants, fish, and, most importantly, diverse bacteria, together comprise a complex and self-regulating ecosystem. Upward Farms leverages automation, monitoring, and control systems to precisely quantify and predictively control the functional biodiversity of these complex farm environments to maximize production and stability. The innovation that results from embracing this complexity will become more important and valuable over time as ecosystem engineering becomes integral to increasing productivity across the economy.

Introduction

Upward Farms is an indoor agriculture company that has developed an extraordinarily efficient biomanufacturing system based on ecosystem engineering. Broadly writ, Upward Farms is a systems engineering company, where the system is composed of hardware, software, and wetware – i.e., sensors and automation, monitoring and control algorithms, and biology. The biological engine that makes this system possible is integrated aquaculture, in which plants, fish, and, most importantly, bacteria, comprise an ecosystem and exist in self-regulating nutrient loops. The combination of ecosystem engineering and mechanical engineering, coupled to automation and machine learning, yields an extremely productive manufacturing system, and one that benefits from rapidly falling costs across the constituent technologies. Taken together, Upward Farms operates at the nexus of the three techno-economic trends shaping 21st century industrial capacity: software, automation, and the engineering of biological systems.

There is impressive complexity in this vision, to be sure, but tools exist to manage this complexity. These tools were initially developed for the automotive, aviation, and consumer electronics industries, and they have already been adapted for use in biological engineering and manufacturing. In applying these tools to the entire problem of bioproduction, rather than to individual aspects, the Company is positioned to outcompete all comers.

Utilizing biodiversity, rather than minimizing it, is the Company’s most important innovation. Quantitative field studies have conclusively demonstrated that complex ecosystems are more productive and stable than monocultures. By embracing ecological complexity, and learning to engineer it, Upward Farms benefits from these natural processes in its indoor farms.

Aggregating these insights, it becomes clear that, far more than simply managing buildings to grow greens and fish, Upward Farms is a high technology company that will drive innovation at the intersection of hardware, software, and ecosystem engineering. The Company will produce not just food, but also intellectual property and proprietary practical knowledge with broad value. In what follows, I illustrate how all these pieces come together by using examples and analogies from other mature industries as well as emerging technologies developed and demonstrated by Bioeconomy Capital portfolio companies.

Over the longer term, we (Bioeconomy Capital) see an opportunity to make ecosystems engineering the basis of a general purpose bio-manufacturing foundry – a factory capable of renewably producing biological outputs (including drugs, chemicals, and materials) beyond the current goal of food. We see Upward Farms as critical infrastructure for the 21st century.

Seeing The End Of Oil

Summary. The end of petroleum is in sight. The reason is simple: the black goo that powered and built the 20th century is now losing economically to other technologies. Petroleum is facing competition at both ends of the barrel, from low value, high volume commodities such as fuel, up through high value, low volume chemicals. Electric vehicles and renewable energy will be the most visible threats to commodity transportation fuel demand in the short term, gradually outcompeting petroleum via both energy efficiency and capital efficiency. Biotechnology will then deliver the coup de grace, first by displacing high value petrochemicals with products that have lower energy and carbon costs, and then by delivering new carbon negative biochemicals and biomaterials that cannot be manufactured easily or economically, if at all, from petrochemical feedstocks.

Bioeconomy Capital is investing to accelerate, and to profit from, the transition away from petroleum to biomanufacturing. We will continue to pursue this strategy beyond the endgame of oil into the coming era when sophisticated biological technologies completely displace petrochemicals, powered by renewable energy and containing only renewable carbon. We place capital with companies that are building critical infrastructure for the 21st century global economy. There is a great foundation to build on.

Biotechnology is already an enormous industry in the U.S., contributing more than 2% of GDP (see “Estimating the biotech sector's contribution to the US economy”; updates on the Bioeconomy Dashboard). The largest component of the sector, industrial biotechnology, comprises materials, enzymes, and tools, with biochemicals alone generating nearly $100B in revenues in 2017 (note that this figure excludes biofuels). That $100B is already between 1/6 and 1/4 of fine chemicals revenues in the U.S., depending on whether you prefer to use data from industrial associations or from the government. In other words, biochemicals are already outcompeting petrochemicals in some categories. That displacement is a clear indication that the global economy is well into shifting away from petrochemicals.

See the Bioeconomy Dashboard for downloadable graphics and additional analysis.

The common pushback to any story about the end of fossil fuels is to assert that nothing can be cheaper than an energy-rich resource that oozes from a hole in the ground. But, as we shall see, that claim is now simply, demonstrably, false for most petroleum production and refining, particularly when you include the capital required to deliver the end use of that petroleum. It is true that raw petroleum is energy rich. But it is also true that it takes a great deal of energy, and a great deal of capital-intensive infrastructure, to process and separate oil into useful components. Those components have quite different economic value depending on their uses. And it is through examining the economics of those different uses that one can see the end of oil coming.

First, let us be clear: the demise of the petroleum industry as we know it will not come suddenly. Oil became a critical energy and materials feedstock for the global economy over more than a century, and oil is not going to disappear overnight. Nor will the transition be smooth. Revenues from oil are today integral to maintaining many national budgets, and thus governments, around the globe. As oil fades away, governments that continue to rely on petroleum revenues will be forced to reduce spending. Those governments have a relatively brief window to diversify their economies away from heavy reliance on oil, for example by investing in domestic development of biotechnology. Without that diversification, some of those governments may fall because they cannot pay their bills. Yet even when oil’s clear decline becomes apparent to everyone, it will linger for many years. Government revenues for low cost producers (e.g., Iran and Saudi Arabia) will last longer than high cost producers (e.g. Brazil and Canada). But the end is coming, and it will be delivered by the interaction of many different technical and economic trends. This post is an outline of how all the parts will come together.

What produces value in a barrel of oil? Ergs and Atoms

Any analysis of the future of petroleum that purports to make sense of the industry must grapple with two kinds of complexity. Firstly, the industry as a whole is enormously complex, with different economic factors at work in different geographies and subsectors, and with those subsectors in turn relying on a wide variety of technologies and processes. In 2017, The Economist published a useful graphic (below — click through to the original) and story (“The world in a barrel”) that explored this complexity. Moreover, the cost of recovering a barrel and delivering it to market in different countries varies widely, between $10 and $70. Further complicating analysis, those reported cost estimates also vary widely, depending on both the data source and the analyst: here is The Economist, and here is the WSJ, and note that these articles cite the same source data but report quite different costs. The total market value of petroleum products is about $2T per year, a figure that of course varies with the price of crude.

Secondly, “a barrel of oil” is itself complex; that is, barrels are neither the same nor internally homogeneous. Not only are barrels from different wells composed of different spectra of molecules (see the lower left panel above in “Breaking down oil”), but those molecules have very different end uses. Notably, on average, of the approximately 44 gallons per barrel worth of products that are generated during petroleum refining, >90% winds up as heating oil or transportation fuel. Another approximately 5% comprises bitumen and coke. Both of these are are low value; bitumen (aka “tar”) gets put on roads and coke is often combined with coal and burned. In other words, about 42 of the 44 gallons of products from a barrel of oil are applied to roads or burned for the energy (the ergs) they contain.

The other 2% of a barrel, or 1-2 gallons depending on where it comes from, comprise the matter (the atoms) from which we build our world today. This includes plastics precursors, lubricants, solvents, aromatic compounds, and other chemical feedstocks. After being further processed via synthetic chemistry into more complex compounds, these feedstocks wind up as constituents of nearly everything we build and buy. It is widely repeated that chemical products are components of 96% of U.S.-manufactured goods. That small volume fraction of a barrel of oil is thus enormously important for the global economy; just ~2% of the barrel produces ~25% of the final economic value of the original barrel of crude oil, to the tune of more than $650B annually.

Cheaper Ergs

The big news about the ergs in every barrel is that their utility is coming to an end because the internal combustion engine (ICE) is on its way out. Electric vehicles (EVs) are coming in droves. EVs are far more efficient, and have many fewer parts, than ICE powered vehicles. Consequently, maintenance and operating costs for EVs are signficantly lower than for ICE vehicles. Even a relatively expensive Tesla Model 3 is cheaper to own and operate over 15 years than is a Honda Accord. Madly chasing Tesla into the EV market, and somewhat late to the game, Volkswagen has announced it is getting out of manufacturing ICEs altogether. Daimler will invest no more in ICE engineering and will produce only electric cars in the future. Daimler is also launching an electric semi truck in an effort to compete with Tesla’s forthcoming freight hauler. Not to be left out, VW just announced its own large investment into electic semi trucks. Adding to the trend, last week Amazon ordered 100,000 electric delivery trucks. Mass transit is also shifting to EVs. Bloomberg reported earlier in 2019 that, by the end of this year “a cumulative 270,000 barrels a day of diesel demand will have been displaced by electric buses.” In China total diesel demand is already falling, gasoline demand may well peak this year (see below). Bloomberg points to EVs as the culprit. Finally, as described in a recent report by Mark Lewis at BNP Paribas, the combination of renewable electricity and EVs is already 6-7X more capital efficient than fossil fuels and ICEs at delivering you to your destination; i.e. oil would have to fall to $10-$20/barrel to be competitive.

(Click through image to story.) From “China Is Winning the Race to Dominate Electric Cars”, Nathaniel Bullard, Bloomberg, 20 September, 2019.

Consequently, for the ~75% of the average barrel already directly facing competition from cheaper electricity provided by renewables, the transition away from oil is already well underway. Gregor Macdonald covers much of this ground quite well in his short book Oil Fall, as well as in his newsletter. Macdonald also demonstrates that renewable electricity generation is growing much faster than is EV deployment, which puts any electricity supply concerns to rest. We can roll out EVs as fast as we can build them, and anyone who buys and drives one will save money compared to owning and operating a new ICE vehicle. Forbes put it succinctly: “Economics of Electric Vehicles Mean Oil's Days As A Transport Fuel Are Numbered.”

But it isn’t just the liquid transportation fuel use of oil that is at risk, because it isn’t just ergs that generate value from oil. Here is where the interlocking bits of the so-called “integrated petroleum industry” are going to cause financial problems. Recall that each barrel of oil is complex, composed of many different volume fractions, which have different values, and which can only be separated via refining. You cannot pick and choose which volume fraction to pull out of the ground. As described above, a disproportionate fraction of the final value of a barrel of oil is due to petrochemicals. In order to get a hold of the 2% of a barrel that constitutes petrochemical feedstocks, and thereby produce the 25% of total value derived from those compounds, you have to extract and handle the other 98% of the barrel. And if you are making less money off that 98% due to decreased demand, then the cost of production for the 2% increases. It is possible to interconvert some of the components of a barrel via cracking and synthesis, which might enable lower value compounds to become higher value compounds, but it is also quite expensive and energy intensive to do so. Worse for the petroleum industry, natural gas can be converted into several low cost petrochemical feedstocks, adding to the competitive headwinds the oil industry will face over the coming decade. Still, there is a broad swath of economically and technologically important petroleum compounds that currently have no obvious replacement. So the real question that we have to answer is not what might displace the ergs in a barrel of oil — that is obvious and already happening via electrification. The much harder question is: where do we get all the complex compounds — that is, the atoms, in the form of petrochemicals and feedstocks — from which we currently build our complex economy? The answer is biology.

Biochemicals are already competing with petrochemicals in a ~$650B global market.

Renewable atoms

Bioeconomy Fund 1 portfolio companies Arzeda, Synthace, and Zymergen have already demonstrated that they can design, construct, and optimize new metabolic pathways to directly manufacture any molecule derived from a barrel of oil. Again, at least 17%, and possibly as much as 25%, of US fine chemicals revenues are already generated by products of biotechnology. To be sure, there is considerable work to do before biotechnology can capture the entire ~$650B petrochemical revenue stack. We have to build lots of organisms, and lots of manufacturing capacity in which to grow those organisms. But scores of start-ups and Fortune 50 companies alike are pursuing this goal. As metabolic engineering and biomanufacturing matures, an increasing number of these companies will succeed.

The attraction is obvious: the prices for high value petrochemicals are in the range of $10 to $1000 per liter. And whereas the marginal cost of production for petroleum products is around $20 billion dollars — the cost of a new refinery — the marginal cost of production for biological production looks like a beer brewery, which comes in at between $100,000 and $10 million, depending on the scale. This points to one of the drivers for adopting biotechnology that isn’t yet on the radar for most analysts and investors: the return on capital for biological production will be much higher than for petroleum products, while the risk will be much lower. This gap in understanding the current and future advantages of biology in chemicals manufacturing shows up in overoptimistic growth predictions all across the petroleum industry.

For example, the IEA recently forecast that petrochemicals will account for the largest share of demand growth for the petroleum industry over the next two decades. But the IEA, and the petroleum industry, are likely to be surprised and disappointed by the performance of petrochemicals. This volume fraction is, as noted above, already being replaced by the products of biotechnology. (Expected demand growth in “Passenger vehicles”, “Freight”, and “Industry”, which uses largely comprise transportation fuel and lubricants, will also be disappointing due to electrification.) We should certainly expect the demand for materials to grow, but Bioeconomy Capital is forecasting that by 2030 the bulk of new chemical supply will be provided by biology, and that by 2040 biochemicals will be outcompeting petrochemicals all across the spectrum. This transition could happen faster, depending on how much investment is directed at accelerating the roll out of biological engineering and manufacturing.

Before moving on, we have to address the role of biofuels in the future economy. Because biofuels are very similar to petroleum both technologically and economically — that is, biofuels are high volume, low margin commodities that are burned at low efficiency — they will generally suffer the same fate, and from the same competition, as petroleum. The probable exception is aviation fuel, and perhaps maritime fuel, which may be hard to replace with batteries and electricity for long haul flights and transoceanic surface shipment.

But this likely fate for biofuels points to the use of those atoms in other ways. As of 2019, approximately 10% of U.S. gasoline consumption is contributed by ethanol, as mandated in the Renewable Fuels Standard. That volume is the equivalent of 4% of a barrel of oil, and it is derived from corn kernels. As ethanol demand falls, those renewably-sourced atoms will be useful as feedstocks for products that displace other components of a barrel of oil. The obvious use for those atoms is in the biological manufacture of chemicals. Based on current yields of corn, and ongoing improvements in using more of each corn plant as feedstock, there are more than enough atoms available today just from U.S. corn harvests, let alone other crops, to displace the entire matter stream from oil now used as petrochemical feedstocks.

Beyond Petrochemistry

The economic impact of biochemical manufacturing is thus likely to grow significantly over the next decade. Government and private sector investments have resulted in the capability today to biomanufacture not just every molecule that we now derive from a barrel of petroleum, but, using the extraordinary power of protein engineering and metabolic engineering, to also biomanufacture a wide range of new and desirable molecules that cannot plausibly be made using existing chemical engineering techniques. This story is not simply about sustainability. Instead, the power of biology can be used to imbue products with improved properties. There is enormous economic and technical potential here. The resulting new materials, manufactured using biology, will impact a wide range of industries and products, far beyond what has been traditionally considered the purview of biotechnology.

For example, Arzeda is now scaling up the biomanufacturing of a methacrylate compound that can be used to dramatically improve the properties of plexiglass. This compound has long been known by materials scientists, and long been desired by chemical engineers for its utility in improving such properties as temperature resistance and hardness, but no one could figure out how to make it economically in large quantities. Arzeda's biological engineers combined enzymes from different organisms with enzymes that they themselves designed, and that have never existed before, to produce the compound at scale. This new material will shortly find its way into such products as windshields, impact resistant glass, and aircraft canopies.

Similarly, Zymergen is pursuing remarkable new materials that will transform consumer electronics. Zymergen is developing a set of films and coatings that have a set of properties unachievable through synthetic chemistry and that will be used to produce flexible electronics and displays. These materials simply cannot be made using the existing toolbox of synthetic chemistry; biological engineering gives access to a combination of material properties that cannot be formulated any other way. Biological engineering will bring about a renaissance in materials innovation. Petroleum was the foundation of the technology that built the 20th century. Biology is the technology of the 21st century.

Financing risk

The power and flexibility of biological manufacturing create capabilities that the petroleum industry cannot match. Ultimately, however, the petroleum industry will fade away not because demand for energy and materials suddenly disappears, or because that demand is suddenly met by renewable energy and biological manufacturing. Instead, long before competition to supply ergs and atoms displaces the contents of the barrel, petroleum will die by the hand of finance.

The fact that both ends of the barrel are facing competition from technologically and economically superior alternatives will eventually lead to concerns about oil industry revenues. And that concern will reduce enthusiasm for investment. That investment will falter not because total petroleum volumes see an obvious absolute drop, but rather because the contents of the “marginal barrel” – that is, the next barrel produced – will start to be displaced by electricity and by biology. This is already happening in China and in California, as documented by Bloomberg and by Gregor Macdonald. Thus the first sign of danger for the oil industry is that expected growth will not materialize. Because it is growth prospects that typically keep equities prices high via demand for those equities, no growth will lead to low demand, which will lead to falling stock prices. Eventually, the petroleum industry will fail because it stops making money for investors.

The initial signs of that end are already apparent. In an opinion piece in the LA Times, Jagdeep Singh Bachher, the University of California’s chief investment officer and treasurer, and Richard Sherman, chairman of the UC Board of Regents’ Investments Committee, write that “UC investments are going fossil free. But not exactly for the reasons you may think.” Bachher and Sherman made this decision not based on any story about saving the planet or on reducing carbon emissions. The reason for getting rid of these assets, put simply, is that fossil fuels are no longer a good long-term investment, and that other choices will provide better returns:

We believe hanging on to fossil fuel assets is a financial risk [and that] there are more attractive investment opportunities in new energy sources than in old fossil fuels.

An intriguing case study of perceived value and risk is the 3 year saga of the any-day-now-no-really Saudi Aramco IPO. Among the justifications frequently mooted for the IPO is the need to diversify the country's economy away from oil into industries with a brighter future, including biotechnology, that is, to ameliorate risk:

The listing of the company is at the heart of Prince Mohammed’s ambitious plans to revamp the kingdom’s economy, with tens of billions of dollars urgently needed to fund megaprojects and develop new industries.

There have been a few hiccups with this plan. The challenges that Saudi Aramco is facing in its stock market float are multifold, from physical vulnerability to terrorism, to public perception and industry divestment, through to concerns about the long-term price of oil:

When Saudi Arabia’s officials outlined plans to restore output to maximum capacity after attacks that set two major oil facilities ablaze on Saturday, they were also tasked with convincing the world that the national oil company Saudi Aramco was investable.

The notion that the largest petroleum company in the world might have trouble justifying its IPO, and might have trouble hitting the valuation necessary to raise the cash its current owners are looking for, is eye opening. This uncertainty creates the impression that Aramco may have left it too late. The Company managers may see less value from their assets than they had hoped, precisely because increased financial risk is reducing that value.

And that is the point — each of the factors discussed in this post increases the financing risk for the petroleum industry. Risk increases the cost of capital, and when financiers find better returns elsewhere they rapidly exit the scene. This story will play out for petroleum investments just as it has for coal. Watch what the bankers do; they don’t like to lose money, and the writing is on the wall already. In 2018, global investment in renewable electricity generation was three times larger than the investment in fossil fuel powered generation. Biotechnology already provides at least 17% of chemical industry revenues in the U.S., and is growing in the range of 10-20% annually (see the inset in Figure 2). If you put the pieces together, you can already see the end of oil coming.